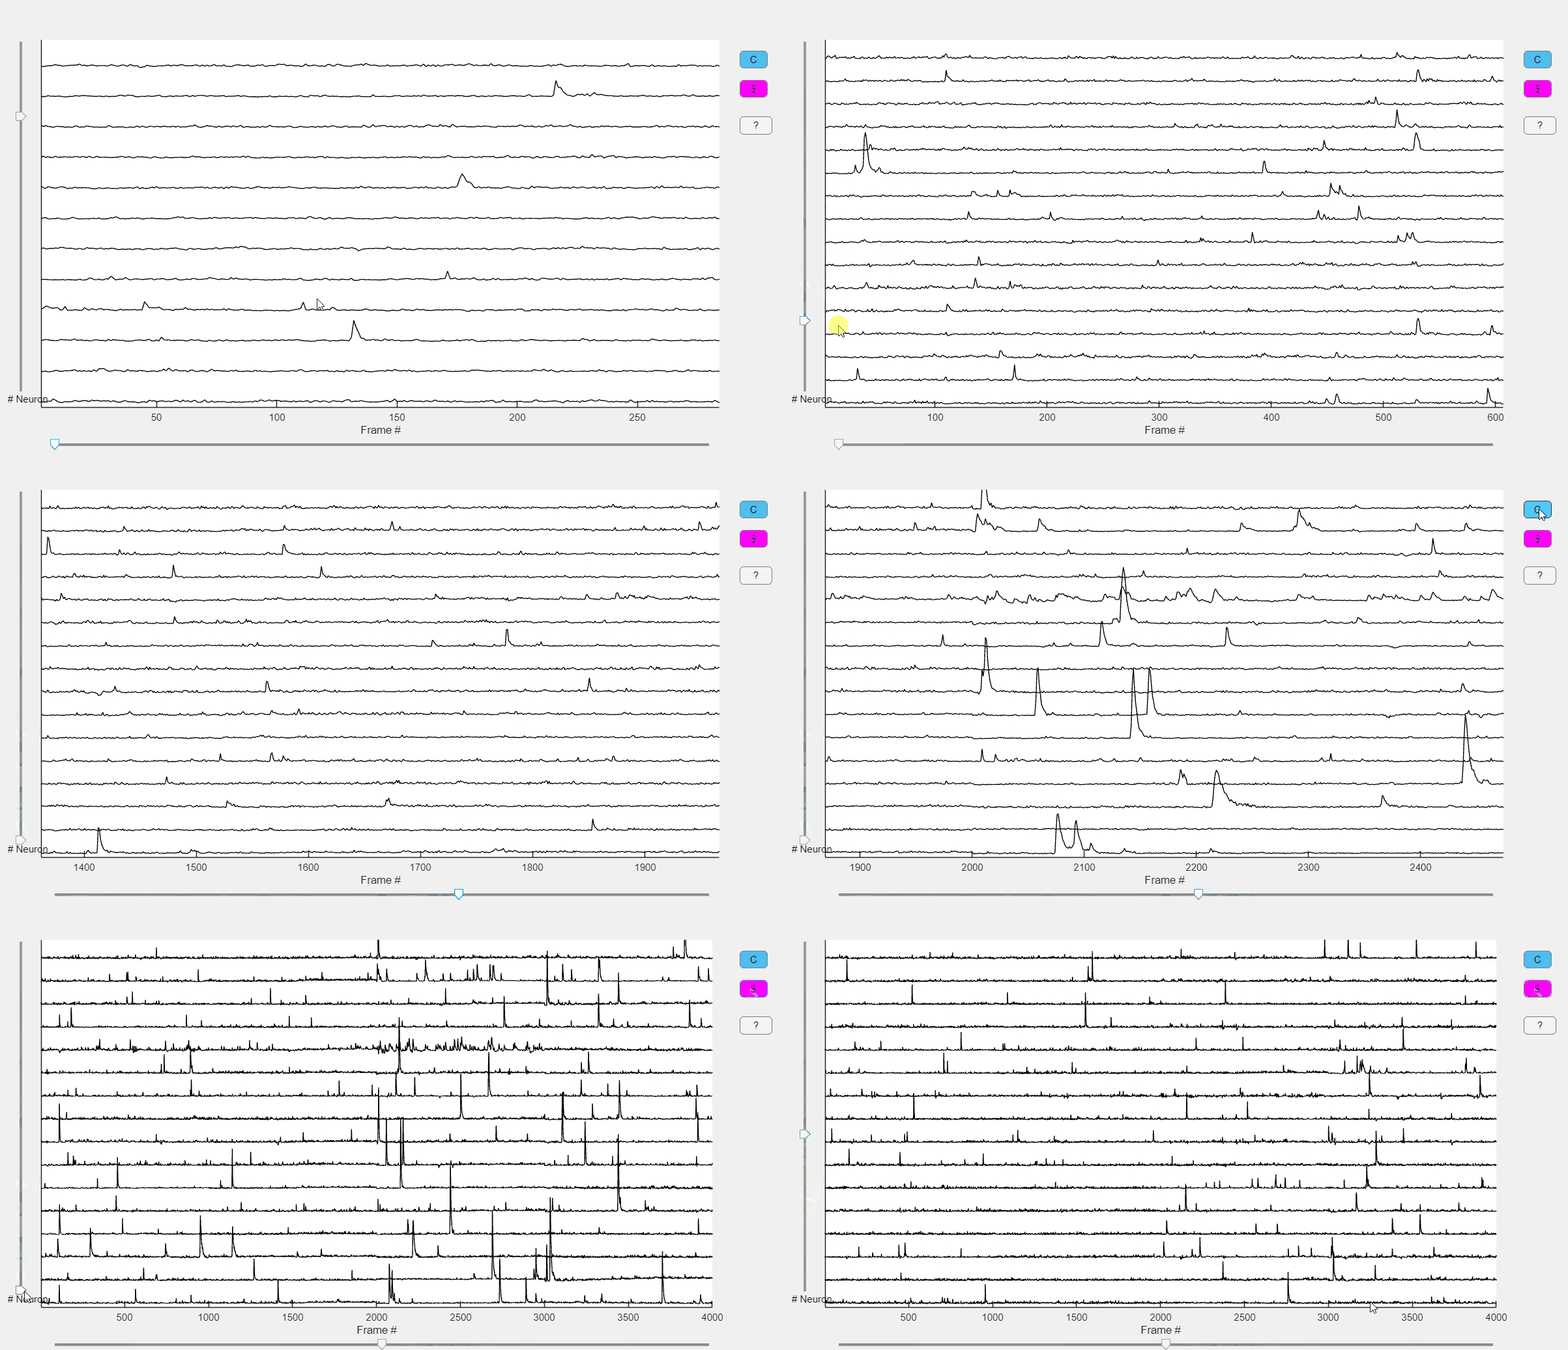
View traces
view_traces
Syntax
Description
Interactive visualization of calcium traces obtained with CNMF-E.
Function Inputs:
| Parameter Name | Type | Description |
|---|---|---|
| Neuron | CNMF-E neuron object | Output of CNMF-E and CaliAli_cnmf() |
Function Outputs:
None (displays the selected traces interactively).
Example usage:
Monitoring Extracted Calcium Transients
CaliAli includes an app to plot the extracted calcium signals. After loading the neuron object, run view_traces(neuron).

This app includes the following functionalities:
- Left / Right Scroll back or forward. Alternatively, you can use the scroll bar at the bottom of the screen.
- Use the vertical scroll bar to navigate through traces.
- Shift+Up / Shift+Down Increase/decrease the number of traces being displayed.
- Shift+Right / Shift+Left Increase/decrease the temporal resolution.
- Use the mouse scroll wheel to change the vertical zoom.
- Press the
Cbutton to plot the denoised traces. - Press the
Sbutton to plot the predicted rising events.